Corn Might Be Peaking - Part 2
Mar 07, 2025
Zack Gardner
Grain Marketing & Origination Specialist
TYPICALLY, THE WORLD AGRICULTURAL SUPPLY AND DEMAND ESTIMATES REPORT is a nonevent, but this has been the year for eventful reports. Here are the changes that were made in February, which we get to trade off of for the next month.
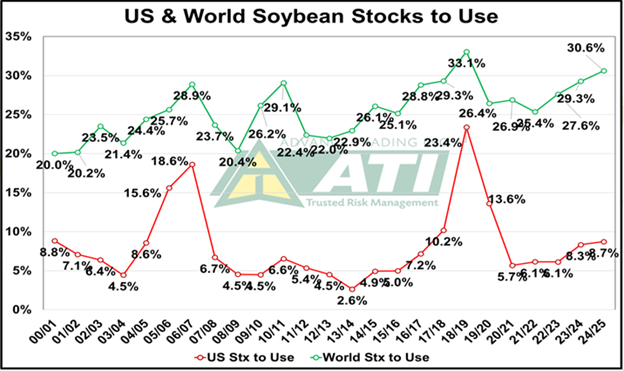
Soybeans

Click to view.
Even with the downward adjustments to Argentina and Paraguay’s soybean production, total South American soy production this year is still up 16.5 MMT (or 606 million bushels) from last year.
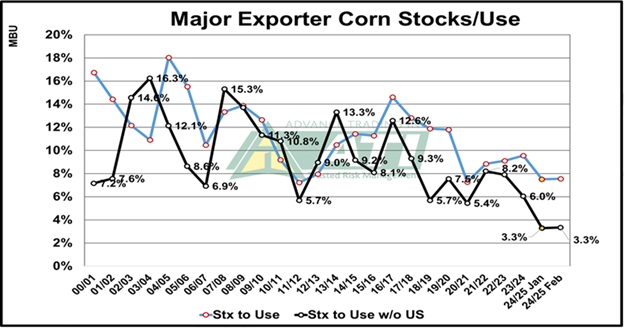
Corn
For reference, the current (old crop) stocks-to-use ratio sits at 10.2 percent, with a carryout of 1.54 billion bushels. The USDA Ag Outlook Forum at the end of February was the first indicator of U.S. acres for this next year. A conservative 93.5 million acre corn number with a trendline of 183.5 bu/acre yield lends us to a 14.9 percent stocks-to-use ratio and a 2.25 billion bushel carryout.
Again, the clock is ticking. As you can see on the chart to the left, corn stocks are tight, but the long Funds traders are running out of time for China to start buying (making our tight stocks tighter) ahead of an acreage report that could send our carryout back above 2.0 billion bushels. They should probably be selling this market off and taking profits ahead of key acreage reports this spring. However, the wild card remains as China potentially buying from a trade deal instead of trade tariffs and April/May weather for Brazil’s safrinha corn crop.

Click to view.
Grain Marketing & Origination Specialist
TYPICALLY, THE WORLD AGRICULTURAL SUPPLY AND DEMAND ESTIMATES REPORT is a nonevent, but this has been the year for eventful reports. Here are the changes that were made in February, which we get to trade off of for the next month.
Soybeans
- The U.S. soybean carryout was left unchanged.
- Brazil’s soybean production was left unchanged at 169 MMT.
- Argentina’s soybean production was lowered by 3 MMT (down to 49 MMT).
- Paraguay’s soybean production was lowered by 0.5 MMT (down to 10.7 MMT).
Click to view.
Even with the downward adjustments to Argentina and Paraguay’s soybean production, total South American soy production this year is still up 16.5 MMT (or 606 million bushels) from last year.
Corn
- The U.S. corn carryout was left unchanged.
- Brazil’s corn production was lowered by 1 MMT (down to 126 MMT).
- Argentina’s corn production was lowered by 1 MMT (down to 50 MMT).
- Chinese corn imports were lowered by 3 MMT (down to 10 MMT).
- A 3 MMT demand decrease is greater than a 2 MMT supply decrease.
For reference, the current (old crop) stocks-to-use ratio sits at 10.2 percent, with a carryout of 1.54 billion bushels. The USDA Ag Outlook Forum at the end of February was the first indicator of U.S. acres for this next year. A conservative 93.5 million acre corn number with a trendline of 183.5 bu/acre yield lends us to a 14.9 percent stocks-to-use ratio and a 2.25 billion bushel carryout.
Again, the clock is ticking. As you can see on the chart to the left, corn stocks are tight, but the long Funds traders are running out of time for China to start buying (making our tight stocks tighter) ahead of an acreage report that could send our carryout back above 2.0 billion bushels. They should probably be selling this market off and taking profits ahead of key acreage reports this spring. However, the wild card remains as China potentially buying from a trade deal instead of trade tariffs and April/May weather for Brazil’s safrinha corn crop.
Click to view.